Into the Weeds: UK Deaths Data
Teens and young adults show consistently higher non-Covid deaths among the "fully" vaccinated in a UK report. But is it a statistical illusion?
A four-post series yesterday by “Bartram,” who writes at Bartram’s Folly, reviews a new UK ONS report on “Covid” and “non-Covid” deaths by age group throughout 2021.1 The first post:
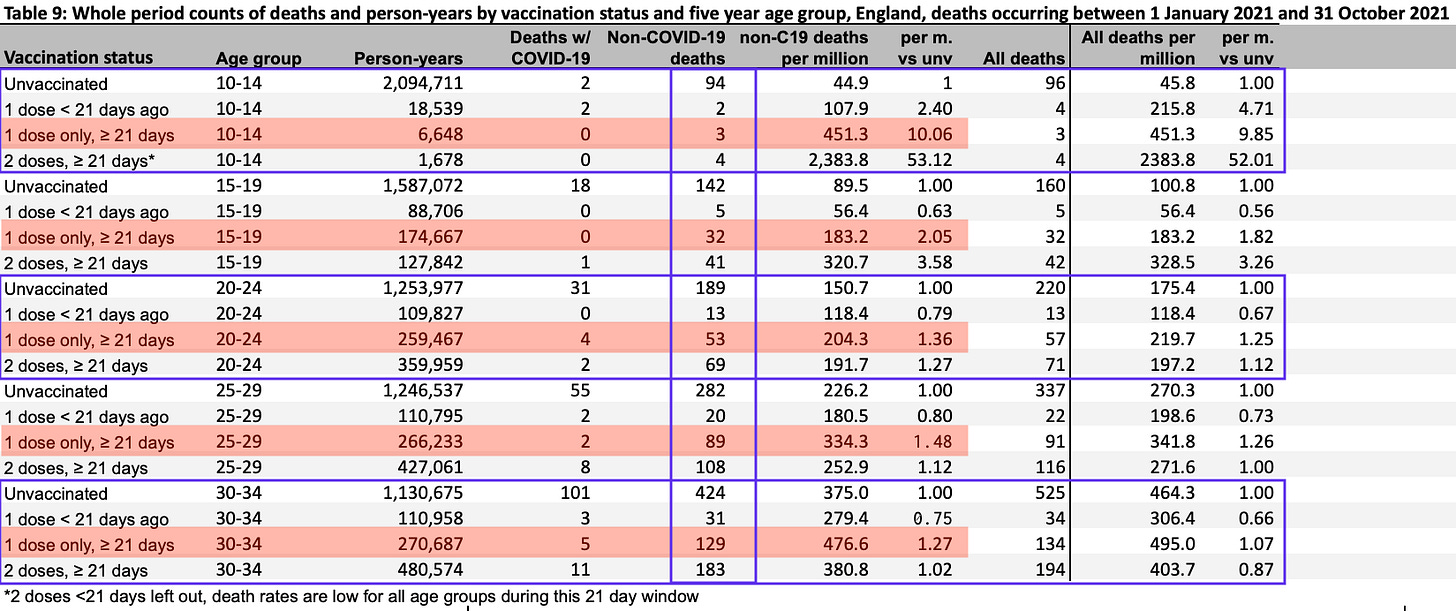
What a particular linked spreadsheet in the ONS report offers, crucially, is 5-year age breakdowns of non-Covid deaths by Covid-vaccination status. This allows for an illuminating look at young groups who are often lumped in with the nearly-middle-aged. The outcomes are not great. See Bartram’s second post for the headline chart presenting the values below in a digestible graphic form. At certain times, I prefer raw numbers:
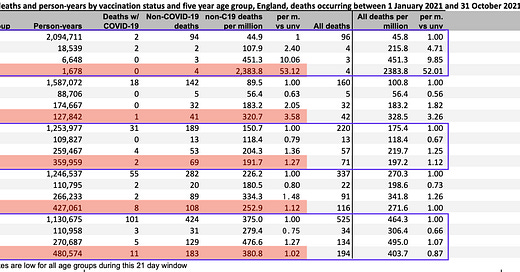
The above is the result of my spending some time mauling the data included in Table 9 of the spreadsheet linked in Section 6 of the report, “Deaths by vaccination status data.” It shows what seems to be the key headline: Among younger Brits, the “fully vaccinated” are experiencing a higher rate of “non-Covid 19” deaths than the unvaccinated in every age bracket.
But having the raw data all on one screen allows us to spot some caveats to this conclusion.
First, a note on the dataset. The ONS report starts with a fairly tidy framework: Individuals who are in all three of the Public Health Data Asset, and the 2011 Census, and the GP Patient Register make up the data. These comprise an estimated 79% of individuals over age 10 in England. Both “person-years” and “deaths” come from the 79% set, so we may think of this cohort as a sort of “virtual country” within England, sparing us the problems with the notoriously suspicious denominators of the UKHSA reports.
ONS-kingdom further divides its citizens by age, and vaccination status:
Unvaccinated
1st-dosed less than 21 days ago
1st-dosed 21+ days ago
2nd-dosed less than 21 days ago
2nd-dosed 21+ days ago
(Boosters are not considered separately.)
The chart we are considering tallies how much time was spent in any category altogether for a given age group, producing the “person-years” denominator we use for exposure risk. Deaths are similarly assigned to the category the individual was in at the time of the record.
As expected, the 1st dose over 21 days rates come out terribly. These are probably skewed by individuals who could not take their second dose due to a medical issue. This is a common data artifact, and an obvious potential signal for adverse events - and here, the high-ish absolute death counts are particularly frightening:
Now, to our caveats regarding our main focus, the fully vaccinated. First, the most startling “relative non-Covid death risk” is among 10-14 year old double-vaccinated. But we can see from the person-year denominators that very few in this age group were double-vaccinated, in the study time window. If these were the more heavily-prioritized clinically vulnerable, that could account for the outlandish death rate. Either way, the absolute number of deaths in question is only 4. The 1st-dose outcomes similarly ride the knife’s edge near 0:
Moving on to the more important “caveat,” for the figures for 15 and older. The entire reason I wanted to highlight the ONS post, again, is to temper expectations about which age groups will turn out to be driving the excess deaths in various parts of the world in 2021. For this portion of the data, the catch is to question afresh why we should exclude deaths “involving” Covid-19 among the very young?
Even up to the 30 to 34 year-olds, the majority who end up dying in proximity to a positive test for SARS-CoV-2 are not taken by the virus. They may not even be taken by “infection + comorbidities.” Rather, they are probably “with, not from” false positives: they were admitted to the hospital for something else, occasionally shortly before death, and happened to test positive after admission.
The absurdity of recommending the Covid vaccines to these age groups is that the only likely benefit is that such “happen to test positives” are avoided, and the Covid-vaccinated young are not mislabeled as deaths with Covid 19. But most of the unvaccinated still are.
For this reason, it makes sense to compare “with” and “without” Covid 19 deaths together, as there are no true withs (or very few). Thus, the “all deaths relative risk” reveals a more nuanced story:
Here, the trend is not so consistent. Results are still quite alarming for the 15-19 year-old fully vaccinated; but could this, again, be a result of prioritizing the vulnerable? Person-years remain low for this cohort. By the time we are in the 30-34 cohort, the fully vaccinated outperform the unvaccinated baseline. But here there is probably some room for a blend between false positives and true “with” Covid 19 deaths, in the unvaccinated group.
My last remark concerns the absolute numbers that drive these results for the fully vaccinated young. Together, they are:
4 + 42 + 71 + 116 + 194 = 427
Recalling the “bombshell” Indiana insurance report from the beginning of this month, which asserted that “deaths are up 40% among people ages 18-64,”2 we can thus take this value and compare it to the death rates for Brits between 40 and 64 during the same period:
To these numbers, another 427 is nothing.
The excess mortality trends seen in various regions, this ONS data suggests, are most likely being driven by those 40 and older, and at least partially by unvaccinated deaths “with” or from infection with SARS-CoV-2.3
See Section 6 for the spreadsheet that contains the all deaths figures.
See “Indiana Down.”
As originally speculated in “Invisible Apocalypse.”


Interesting, thanks! The data is only up to Oct so boosters had barely started so will be interesting to see future updates.
On a separate note:
Only 6,183 people died solely of COVID-19 in England & Wales
And only 833 under 60s.
https://nakedemperor.substack.com/p/only-6183-people-died-solely-of-covid
Very interesting, thanks. As you say, the comparison between vaccinated and unvaccinated for the under 19s will likely be fairly significantly skewed by the vaccinated cohort having a higher % of vulnerable individuals. Indeed as far as I remember it was only the vulnerable in that age range who were offered the vaccine initially. Thus I think it may be dangerous to read too much into these numbers.
For 19-34 cohort, the fact there isn't a clear signal of excess all cause mortality for vaccinated vs. unvaccinated is surely quite reassuring? Especially as the aformentioned 'vulnerable' bias is likely still present in this age range, albeit much weaker (I haven't seen good data on this though, just a hunch).
I'm not clear why the picture should be much different for > 40 age? Is your point that adverse reactions to the vaccine increase with age?
In terms of 'excess mortality trends seen in various regions', I think it is worth also pointing out there are regions / countries where this is not the case.