Ah, here goes the bold claim again:
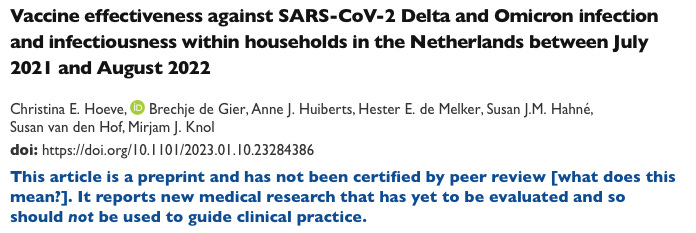
[A] big new Dutch study suggests people who received a booster may have a 30 to 60 percent higher risk of catching Omicron than the unvaccinated.1
No matter how many times Alex Berenson or anyone else triumphantly slams this kid-sized basketball, they will not be making their readers better apprised of reality.2
Now, lest the reader think I am simply, as the scientific term goes, “butt-hurt” that studies are refuting something I want to believe (which isn’t even true, I have been speculating that negative infection efficacy might “soon arise” for over a year), the first of the recent studies showing that the boosted are now being infected the most was highlighted by none other than me.
In this, the “boosted” reported twice as many infections in the prior two weeks as the unvaccinated.
So why didn’t I slam this one down the hoop?
The difference was that before presenting that study’s results to the reader, I carefully unpacked the same, and noticed that the boosted also had the lowest rate of reported prior infection. This survey was therefore only showing negative “real-time” efficacy, or “catching up.” The boosted still hadn’t been infected more overall. Things were just approaching equilibrium.
I found this result astonishing.
It did not match my priors, which included an assumption that virtually everyone had already met the virus by winter, and the boosted really were in true negative efficacy a long time ago (given the lower-quality data available at the time, such as the Walgreens dashboard).
But it was what it was.
This was followed by the recent Cleveland Clinic study. Again, the nitty-gritty details suggest that all that is being observed is the boosted still catching up.
While the title of this post says “always,” it is more accurately reasonably clear at this point that negative efficacy is not going to show in the numbers, if ever, until the next crop of studies examining the current wave of infections.
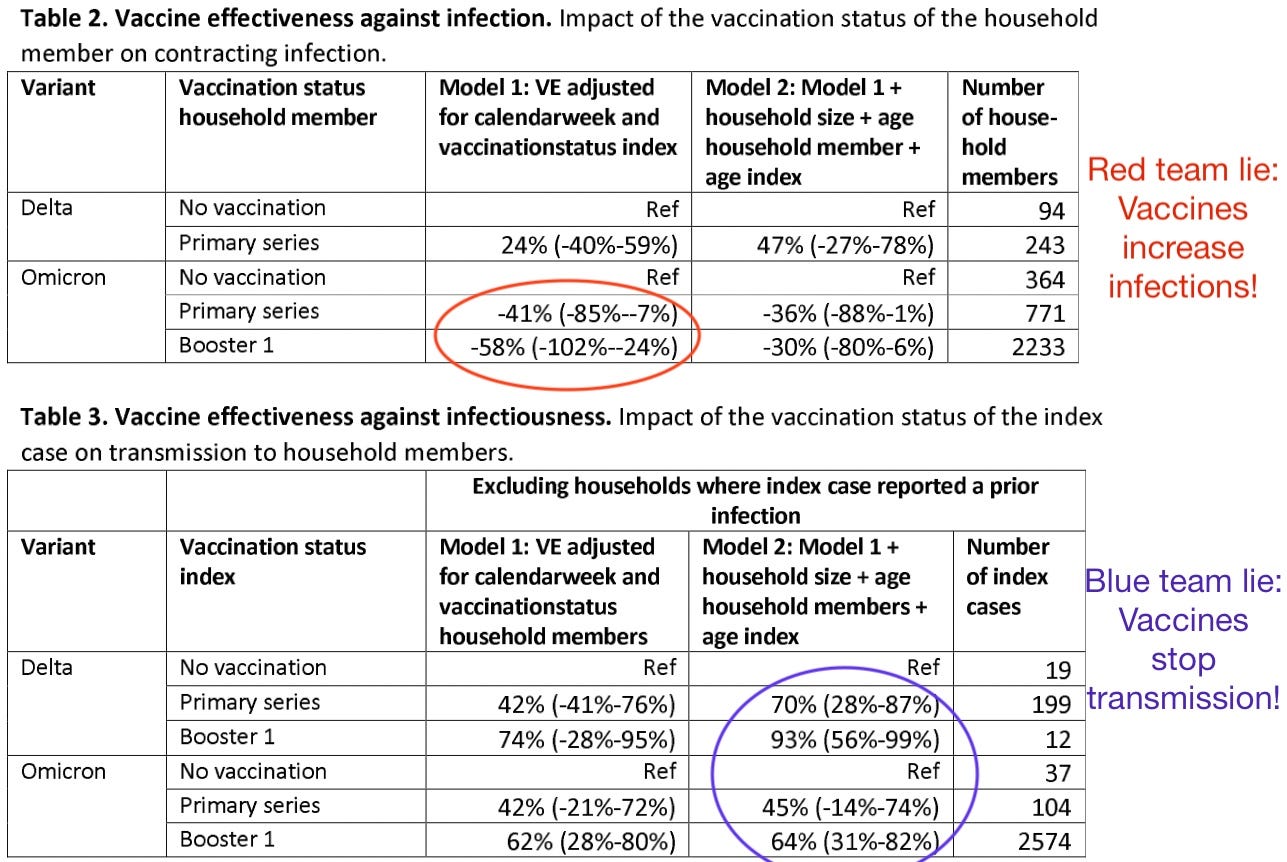
In the meantime, we have another chance to look under the hood of a “negative Omicron infection” study, to see if the highly mathematically tortured headline results (negative a million Omicron infection efficacy in secondary household contacts) are supported by the raw data.3
Spoiler: No.
It’s just the boosted catching-up with meeting the virus again.
Statistics are Not Truth 1: Hoeve, et al. raw “negative efficacy” is much less dramatic, reflects catch-up effect.
The reason I am careful with these kind of small details is that studies lie. The whole reason they are routinely weaponized by pharma and Public Health, Inc. to shove drugs down everyone’s throat is precisely that: They can be made to show differences where there are none.
And, I did not set up Unglossed to be a boutique outlet for “alternate, anti-pharma lies.” There are plenty of other sources for that type of toddler basketball action.
This preprint, particularly, is an excellent case study in how much studies can lie, and how easily confirmation bias could lead to falling for the same lies when it suits whatever one wants to believe.
The authors find two different lies, allowing the reader to pick whichever one leads to a “score,” a mathematical falsehood that can be pocketed away and later repeated endlessly to support their narrative. You can even pick the “model” (garbage black box statistical number-distorter) that maximizes your result!
To highlight the first, seemingly cleaner model, adjusting for calendar week makes no sense in a secondary attack study. Someone is bringing the virus into a house; the study is reporting how many other household members turn out to have a (freely provided) positive test. What does the calendar week have to do with that? Does the Netherlands have a special week where all second cousins go on a cruise?
The raw results, here, show that the models and formula have exaggerated the difference in secondary attack rates magnificently:
40 and 43% infection rate vs 38%?!
Wow! That sure looks like
[A] big new Dutch study suggests people who received a booster may have a 30 to 60 percent higher risk of catching Omicron than the unvaccinated.
38% x 1.3 to 1.6 = 49 to 61
Not 43
Good thing no one waited to check the raw results.
Table A also paints a picture of, what else, the catch-up effect. A higher rate of Delta infections made the unvaccinated more resilient to Omicron. Note, however, that these are different households at different times; they are in all cases a sample of what was going on, and probably that sample was distorted by various biases. Still, the picture is there.
Focusing exclusively on percents:
You might immediately ask, how can the Omicron era reflect balance, if the “boosted” still have a higher infection rate “overall.” The “overall” category, however, neglects that the boosted in the Omicron era were “Primaries” in the Delta era. So a proper overall for this group would reproduce the 93/243 result from the Delta era, resulting in:
Simulated “true” overall booster secondary attack rate
(970+93)/(243+2233) = Oh wait, it’s exactly the same. It’s still 43. That’s it. Pack it in. The toddler basketball slam-dunkers have won.
Not really. This leads us to the problem of lopsided sampling in the Omicron era.
This problem, by the way, would not even be discernible, if the authors did not include one more set of values in the supplemental. So kudos, in the first place, to them for doing so. And in the second place, it should stand as a further warning of how the Truth Opera is never over until etc. As long as there is something missing in the raw data, the study could still be lying — whether in favor of the Blue Team or Red Team narrative.
Statistics are Not Truth 2: Uneven sample sizes in early (Delta and BA.1) vs. late (BA.2 and BA.4) cause the average infections to oversample the catch-up era.
If the catch-up era shows the boosted getting the infections they put off before, while the unvaccinated and double-dosed sail through the storm in their natural immunity cruise ship full of second cousins, then an “overall” rate that over-samples the catch-up era will create a distorted image. And that, very simply, is exactly what happened here. For whatever reason, the authors got more survey responses in the spring and summer, so that the n for catch-up era household infections was much larger than the n for Delta and BA.1.
Delta probably really did cause fewer infections; but BA.1 was likely hugely under-sampled due to holiday disruptions, inability to ramp up survey outreach to match the case overload, etc. This results in the “catch-up” era being over-sampled for the boosted; their composite “Omicron efficacy” is partially missing the period when they were avoiding infections.
Of course, the way to account for this is trivial, simply reproduce an “overall” infection rate by averaging the primary series Delta snapshot with the three different Omicron snapshots, without weighting for sample size (which still totally over-represents BA4/5, but anyway):
Simulated “true” overall booster secondary attack rate, attempt 2:
(.38+.39+.39+.43)/4 = .40
So as the NBA Jam announcer would say,
If you derived value from this post, please drop a few coins in your fact-barista’s tip jar.
Berenson, Alex. “More evidence that American data may badly overstate the protection mRNA shots offer against hospitalization from Covid.” (2023, January 13.) Unreported Truths.
Corrected from “appraise” thanks to a comment from Tardigrade. Apparently, “apprise” is… a word. I thought it was just one of those ticks of speech police officers have.


We need more and better clean data that will explain COVID and the Injections!
::dunks on toddler hoop::
I don't know that the data is solid enough to say for sure that the unvaxxed had higher infection rates than those who got boosted. Especially given we know that after a dose in the primary series infection rates increase in the first 2 weeks due to a temporary immune suppression. Plus we also know that not all infections are confirmed by testing and those who are unvaxxed are perhaps less likely to be tested (except during the height of mandates in late 2021)
Also, a greater number of those getting boosters were in densely populated urban areas which tend to be more liberal meaning they had a higher risk of exposure than the more vaccine resistant conservative folks living in more suburban or rural areas
I still think its a safe bet that pretty much everyone was exposed to COVID before boosting began, even those in non-urban areas
I am still open to the catch up hypothesis with better data but I do believe the vaccines are harming immune systems and increasing infections of all types, so maybe I am biased