Modern advances in childhood mortality (1953-2003), pt. 1
A first look at how childhood mortality changed from 1953 to 2003. And a second look at 1900 to 1950.
This post is the sequel to the examination of childhood mortality in 1951-1953, the years immediately before the Salk polio vaccine. This post presents the ensuing 50 years of mortality reductions in visual form. The past is then revisited, examining whether pre-existing vaccines made any contribution to mortality reductions before 1951. A final post will then look at whether there are any grounds for believing vaccines changed mortality afterward.
i. The dawn of the medical era
If, obviously, childhood mortality had once been much higher before 1953, and no relevant childhood infections save for three had corresponding vaccines before 1953, then obviously vaccines are not responsible for the low rates of death that obtained in the same year.
Indeed, neither is “medicine” itself. The greatest success in pediatric medicine — diphtheria anti-toxin — ameliorated a disease that was responsible for only a small portion of childhood mortality by 19th-century standards. Most sources of infectious deaths decreased “on their own” as a result (partially) of sanitation and water supply improvements, followed by standard-of-living improvements. The latter were driven to a great extent by increased per-capita wealth and the tempering of urban migration and immigration, both of which contributed to lower crowding to a greater extant than could any public health initiative.
Very well: By 1953, as we have seen, infectious disease mortality now contributes a similar portion of childhood deaths as other major diseases. No single category of infectious disease (the highest, influenza and pneumonia, at 7.25% of deaths in childhood) exceeds the overall category of cancer (9.4% of deaths).
After this point, further reductions in deaths from disease, infectious or otherwise, must have a significant contribution from improvements in medical care, even if basic improvements in nutrition and medical access1 still operate to reduce deaths as well. This follows from the general parity between infectious disease deaths and those from such rare conditions as cancer, which itself reflects that very few children are dying to begin with anymore. Thus, 1954 is close to the beginning of the “medical era” of reductions in childhood mortality. Perhaps the “dawn” could be dated to a decade earlier with the advent of modern antibiotics, but in 1954 the morning news is still on the air.
With this as our perspective, we may ask:
Did the three relevant “new” vaccines in use (plus smallpox) have any role in bringing childhood mortality down to the level observed as of 1951-1953;
Did the myriad vaccines subsequently added to the standardized schedule (and to many state school system requirements) have any serious role in the reductions that followed?
Or is it more likely that developments in medicinal care are the limit of mortality reductions that extend beyond mere standard-of-living improvements?
An aside: Why reinvent this wheel?
Some readers will already be familiar with other approaches to this topic, and may ask why another approach should be necessary, or how it could possibly improve upon “look graphs — lines go down before vaccine.”
I believe the method used here will ultimately speak for itself as providing the reader a more solid grasp of the scale of childhood mortality without vaccines. The “look graphs” method makes it clear that this scale is minuscule compared to 19th century mortality rates; the method used here attempts to make it clear that this scale was minuscule compared to how many children survived after their 1st birthday to age 20 in 1953.
Another aside: Again, the polio vaccine is excepted
There is one baby which is not being thrown out with the bathwater in this analysis, and that is the Sabin polio vaccine. Reasons were already briefly supplied in the previous post.
ii. Reductions in childhood mortality, 1953 - 2003: Accidents win again
Briefly, the reader is reminded that in 1951-1953, infectious diseases drove barely more than half as many deaths as accidents alone (about 1/5 vs. 2/5 of deaths), or as all other causes (another 2/5 of deaths).
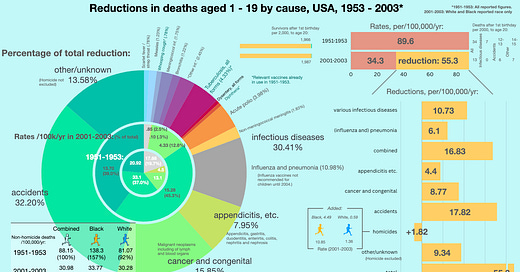
These rates are reproduced in the central pie below, and may be compared with the boundary pie reflecting childhood causes of deaths in 2001-2003. This shows that infectious diseases (the light grey slice) have been more completely reduced than any other category besides “appendicitis, etc.” At the same time, the boundary pie reveals that accidents are still the number one cause of death in children (nearly half of all deaths), and the outer pie shows that they are by a slim margin also the greatest absolute source of reductions over the last 50 years (32.2% of all reductions).2
Most features of this graphic are hopefully self-explanatory. I would call attention to only two aspects.
First, the racial differences question arises again, now combined with the problem of increased homicides in Black teens. This is addressed in a footnote.3 In short, homicides are excluded when possible in order not to distract from improvements in pediatric health.
Second, the top right corner warrants comment: Once again, the “survivor bar” shows just how few children could be expected to die in 1953 to begin with, even counting all the way to age 20. In this light, the subsequent 50 years of reductions in mortality have added 21 survivors to age 20 for every 2,000 kids alive after the 1st birthday. As shown to the far right, about 7 of these added survivors were deaths prevented from infectious disease, about 7 deaths prevented from accidents, and about 8 for whatever remains. Here is an expanded visualization:
All infectious disease death reduction from 1953 - 2003 could at most have contributed as much to child survival as accident death reduction.
This serves to place improvements in infectious disease in context: They are only a partial element of the reduction in childhood mortality after 1953. Since infectious diseases are only directly attributed for a bit less than 1/5 of deaths in 1951-1953, and accidents a bit less than 2/5, this result is not surprising! And of course, this is before even considering whether “prevention” had any major role in this same reduction.
Thanks to whatever caused these reductions — nutrition, treatment, or prevention, in the case of infectious diseases, or automobile design, trauma care, or caution, in the case of accidents — a child in a small town or large school district in 2003 was unlikely to know of any peers who died of infectious disease, but pretty likely to know of some number who died of cancer, or accidents, etc.4
iii. Changes by cause, including homicides
Here again is the raw data for the above graphs, this time including homicides to provide a more accurate idea of how the remainder of “other/unknown” deaths were reduced:

(The reader is encouraged to browse the above graphic and spreadsheet thoroughly, and draw their own impression of the most important points. I can hardly add to what is already in the raw numbers.)
Including homicides, we can compare how much each category was reduced vs. its own baseline rate in 1951-1953 (the rightmost column in the spreadsheet). This is a way of “scoring” improvements in each individual source of mortality:
This will be discussed further in the context of the likely role of vaccines in reducing deaths from infectious diseases.
Finally, we may interrogate the role of vaccines.
iv. Vaccines before 1951
Did existing vaccines deserve any credit for reducing childhood mortality to the rate observed in 1951 - 1953 (19.73% of all deaths in ages 1 to 19, about half as much as deaths from accidents)?
The smallpox vaccine — an unknowable
The smallpox vaccine may or may not have prevented deaths from smallpox in 1951-1953 (the disease was essentially eradicated in the global north by this point). The peculiar history of smallpox is that because the vaccine (the scraping of pus into shoulders) was already in use before the era of urbanization, there is no way to disentangle later reductions in cases from other standard-of-living improvements. It is essentially unknowable whether the vaccine made a difference here.
By the 1950s, continued smallpox vaccination is only justifiable on grounds of possible importation due to travel. In the hypothetical case that no large outbreaks would have happened anyway, then complications from smallpox vaccination were an unnecessary (but small) contributor to mortality. But this too is unknowable.
There are many examples of diseases which “self-attenuated” at the same time as smallpox disappeared in the global north, such as scarlet fever. This was attributed at the time with some mystification to changes in virulence of prevalent streptococcus strains.5

Thus it may lastly have been the case that even if (wild) smallpox still had existed in the US without the vaccine, deaths would have reduced on their own.
Diphtheria vaccine (toxin-antitoxin, toxoid, etc.) - somewhat unknowable
The diphtheria case is complex.
Certain American public health jurisdictions (especially New York City) were early adopters of Park’s toxin-antitoxin vaccine in the years just before 1926. Other jurisdictions began vaccination campaigns later. After 1926, toxoid (treated toxin) is used extensively in continental Europe, Canada, and the United States. The United Kingdom remains cold on diphtheria vaccines until the last weeks of 1941. Also in the 1940s, alum-adjuvant vaccines are developed and marketed in several places, and these improve apparent acquisition of immunity as measured by skin-toxin tests. Other apparent improvements follow the development of combination vaccines that also targeted tetanus toxin and pertussis. Nothing is given a properly controlled trial.
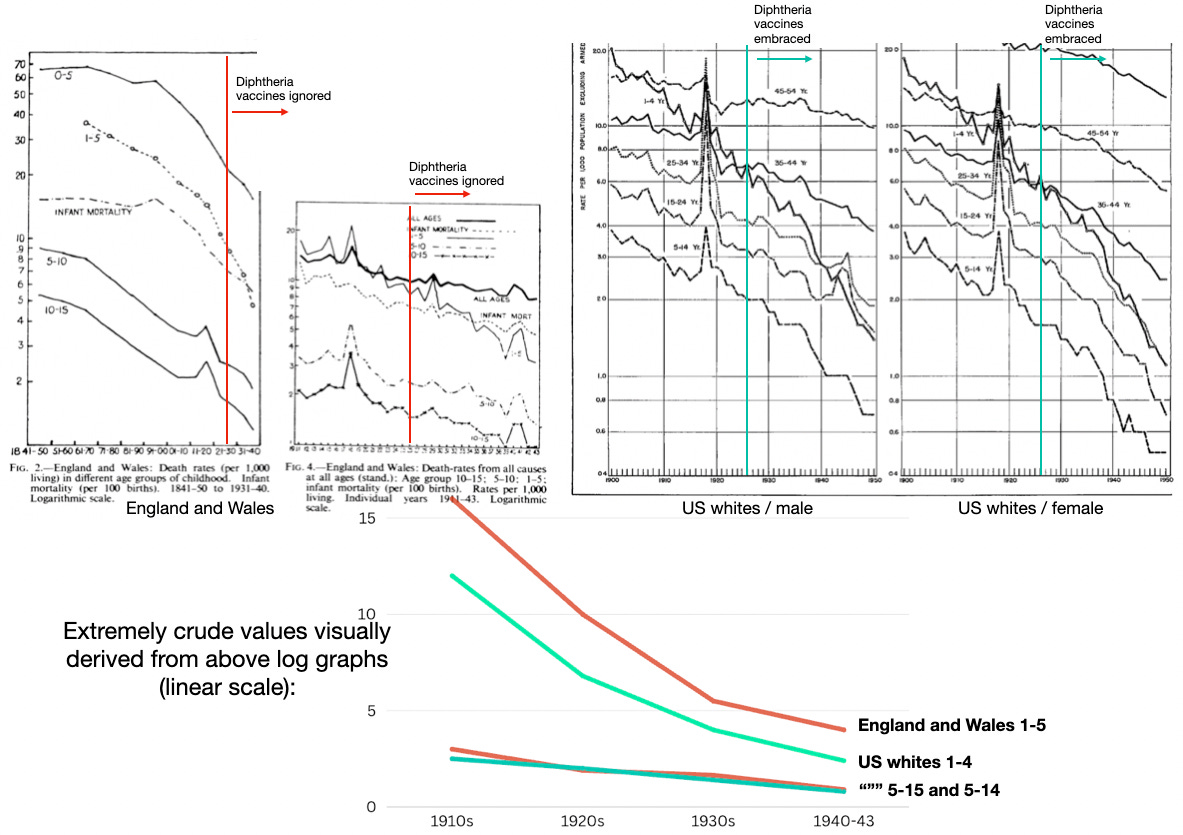
The UK example offers a plausible ceiling on possible childhood mortality reductions from diphtheria vaccines. It should be noted that antitoxin treatment was already in use since 1895 or so, and the baseline death rates shown below for 1911 would already have been substantially lower than a few decades earlier thanks to the use of this treatment. However, in the UK, diphtheria deaths then remained stagnant while they continued to reduce in other countries:

This suggests that the ceiling on childhood mortality is rather high: 30 deaths per 100,000. However, such a circumstantial case is not sufficient to show that the vaccine reduced deaths; diphtheria as a modern childhood disease first emerged in the UK, and so there may have been particular reasons why it was especially slow to attenuate there, even while other diseases like scarlet fever were doing so.
No sign of reductions in overall deaths
Overall deaths offer the first hint of a problem. If the diphtheria vaccine is driving reductions in childhood mortality after 1926, there should be some obvious inflection when comparing countries that used it with the UK. At least when comparing to the US, there is little obvious difference: Both nations experienced relatively accelerated declines in all-cause mortality in the 1-5 age range after 1926, despite limited use of diphtheria vaccines in the UK. While death rates are higher in the UK, this reflects the prevailing trend in 1926 (about 8 per 1,000, compared to about 6). There is no obvious divergence in reductions afterward.

It would appear that the earlier decline in diphtheria mortality in the US (1920s to 1941) is not too relevant to overall mortality improvements.
A slight sign of reductions compared to other diseases
In light of this difficulty, I undertook to plot out disease reductions from 1900 - 1950, and see how diphtheria mortality compares with its peers that lacked specific treatment or vaccines.
Most of the data was obtained from the 1946 Vital Statistics Report, which provides yearly all-ages mortality rates for many diseases from 1900-1946 on pdf pages 71 and 72. Reports for 1949 and 1950 were used for the remaining years.6
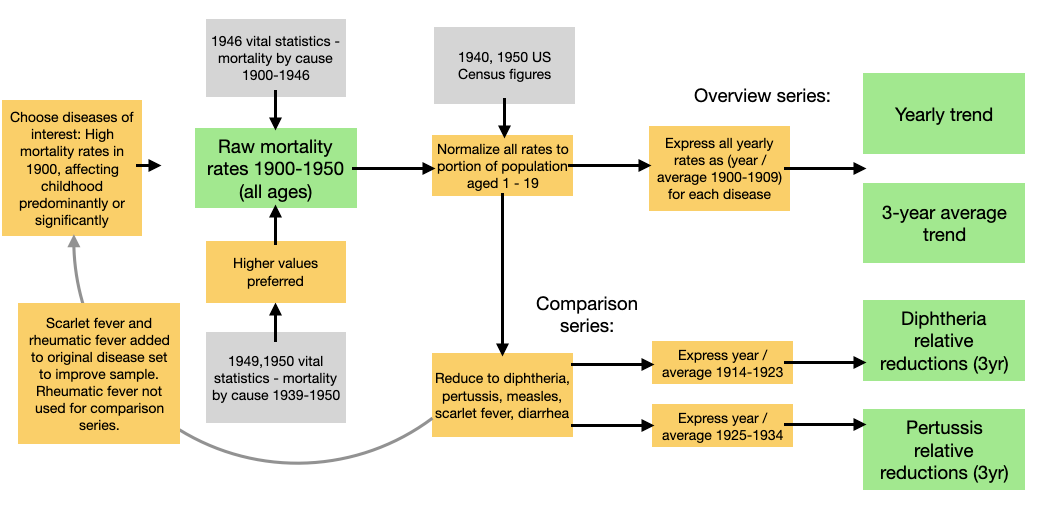
The method pursued from the raw data is described in a footnote.7 The most important features are first that all diseases are plotted self-referentially according to the average mortalities for a baseline time-span. In the overview series, the 1900 - 1909 averages are used as the baseline (i.e. the “100%” for each given disease). Every year is simply expressed as “percent of the baseline” for each disease. Secondly, the raw data is normalized beforehand according to percentage of the population aged 1 - 19 in a given year. This is so it it is clear that it doesn’t just “seem” like diseases are disappearing simply because Americans began to have fewer children — the rates are proportional to however many children there were at the time (with 1900 set as “1”).
First, here is the yearly view with first and last decade mortality rankings:
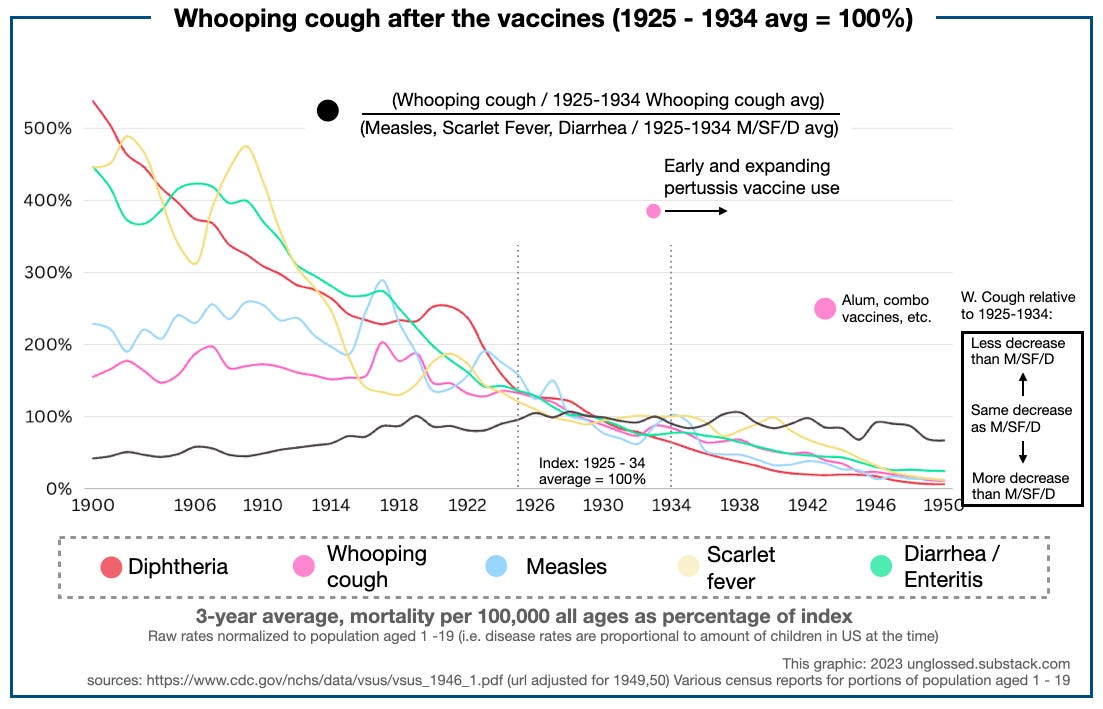
And second, the smoothed, 3-year-average view, with notes on relevant vaccines or treatments:
Using 1900-1909 average mortality as the index, it is clear that all types of infectious disease mortalities are declining “naturally” by 1950. Some have vaccines enter limited use after certain points of time — there is no obvious distinction between these diseases and the overall theme, nor between before and after the vaccine within any given disease.
In terms of overall declines, diphtheria is an early leader, likely due to antitoxin treatment. Typhoid fever (salmonella poisoning), scarlet fever, and diarrhea begin to decline rapidly in 1910; tuberculosis begins a more gradual descent.8 Whooping cough and measles begin to decline after 1917.
Interrogating diphtheria vaccine
Given that mortality reduction is the norm from 1920 - 1950, we should ask for exceptional evidence to believe that the handful of vaccines that existed before 1950 somehow drove reductions in their specific disease classifications.
Our red line, diphtheria, is subject to both relevant treatment (antitoxin) and preventative (various vaccines). From a 1900-1909 average index, it is clear that ensuing mortality declines rapidly, but then enters a period of obstinate resurgence in the 1920s (this was also noted in other countries at the time).
Using an alternate index timespan could offer a look at the diphtheria vaccine. However, there is intrinsic difficulty in setting any clean divide between “pre” and “post” eras. In 1923, Park has already been vaccinating for diphtheria in New York City to a great extent, but few other cities have likely begun any similar efforts. Whatever the extent of vaccination, there is no substantial decline in this era — in fact there is a mild resurgence after 1920, during Park’s preschool campaign in New York City. This results in a minor elevation in the indexed rates for diphtheria in red, and a sharp uptick in the ratio of diphtheria over time to measles, scarlet fever and diarrhea over time (black).
Choosing this era as the index period “wipes clean” prior mortality reductions from diphtheria antitoxin. Our five diseases each start afresh in 1924 with “100 credits,” and later reductions reflect relative gains afterward.
From such a vantage, diphtheria does seem to outperform the comparison diseases of measles, diarrhea / enteritis, and scarlet fever in further reductions. Using the ratio of reduction implies a range of 3 - 20 diphtheria deaths per 100,000 children from the 1930s to 1950 — it lowers as 1950 approaches.
It’s hardly the gold standard of evidence — more like a wooden sign-post. At all events, combined with the UK/elsewhere comparison, the reader may make up their own mind. Personally, I do not find it implausible that the diphtheria vaccine was averting something between 3 to 10 deaths per 100,000 children per year circa 1950, and the evidence seems fairly consistent with such a value.
Pertussis and BCG (Tuberculosis) - knowably irrelevant
There is no serious case for either of these vaccines reducing deaths in children over 1 years old. Overall deaths from both causes were already declining before any substantial use of their respective vaccines.
Whereas diphtheria shows an eventual outperformance vs. trend in measles and diarrhea, whooping cough underperforms even as early, DIY pertussis vaccine efforts are underway in select cities (for example, in Chicago since 1933).
Using 1925 - 1934 as the pertussis pre-vaccine period is fraught with the same difficulties as choosing a divide for diphtheria, but ought to give the pertussis vaccine a “leg up” by wiping clean prior over-performance vs. measles, scarlet fever, and diarrhea mortality. And yet, no benefit is apparent after 1934 — pertussis deaths merely hold to the same trend as all other diseases. If there is any small change after 1943 (when pertussis vaccination becomes more common), it is insufficient to collect any credit for the low rate of pertussis deaths in children previously reviewed in 1951 - 1953. (Besides which, it primarily results from a leveling of diarrhea / enteritis mortality reductions rather than an acceleration in whooping cough reductions.) Pertussis reduced on its own; just less slowly than comparable diseases, despite the vaccine.
Tuberculosis deaths, for their part, were declining in all age groups throughout the entire first half of the 20th century (as well as previously). The all-ages decline are shown in the earlier graph. Declines for specific age groups are shown here:
The United States was cold on the BCG vaccine until circa 1947. By this point, tuberculosis treatments were already undergoing revolutionary advances. It is not at all apparent that the BCG vaccine made any difference.
Conclusion:
Maybe the diphtheria vaccine contributed to childhood mortality reductions before 1951 (but maybe not).
Diphtheria, like polio, was a unique disease from the standpoint of childhood mortality; it increased in prevalence while other diseases declined, and was not especially relevant for adults, who usually already had natural immunity from subclinical exposure in childhood.
Otherwise, the prima-facie case against vaccines having a big role in mortality reductions in children is that infectious disease deaths of all sorts were reducing for all age groups at the same time. This is examined in the next post.
Next: Vaccines after 1953
If you derived value from this post, please drop a few coins in your fact-barista’s tip jar.
Many childhood deaths from diseases result from ignored symptoms. “Access” for children is as much a manner of parent education and outreach as income or location, and this was a major focus in public health in the UK and many US jurisdictions in the decades after 1900.
Sources for this graphic:
Swaroop, S. Albrecht, RM. Grab, B. (1956.) “Accident mortality among children.” Bull World Health Organ. 1956; 15(1-2): 123–163.
Vital statistics reports for 1950 - 1952, for validation of Swaroop et al.’s figures and estimation of rates for certain missing diseases and homicides (1953 does not load, hence the use of 1950):
https://www.cdc.gov/nchs/data/vsus/vsus_1950_1.pdf
https://www.cdc.gov/nchs/data/vsus/vsus_1951_1.pdf
https://www.cdc.gov/nchs/data/vsus/vsus_1952_1.pdf
CDC Wonder: https://wonder.cdc.gov/controller/saved/D76/D368F161
Raw data and substantial notes on methods at https://docs.google.com/spreadsheets/d/1Xqlk-rW19Qd3uUPDF2Nf6c45TMQUIx-UC-S4kMK-BP8/edit?usp=sharing
It is clear that there are substantial differences in non-homicide mortality reduction for Black children, so that relative and absolute differences are minor in 2001-2003. The combined average rates are now even more “in the ballpark” of the rates for whites than they were to begin with. The overall effect for whites is that combining both races slightly overstates how high rates were to begin with and slightly overstates the improvement, but the overall picture is representative enough; while for Blacks the combined picture is far from representative. As before, this is sufficient to use a combined approach for our purposes because the non-representative group is not driving combined trends. But there is one new exception: Homicide increases up to 2001-2003 (among teens) would obliterate the overall reduction in childhood mortality for all other causes in Black children, as well as distort the picture for “other/unknown” deaths among combined and white children. For this reason, homicides are treated separately when possible.
With homicides excluded, the overall picture of reductions is not seriously distorted by rates in Black children. For example, it would not be the case that standard-of-living improvements in Blacks could have driven the reduction to 30.98 combined, since the (“baseline”) combined rates in 1951-1953 were quite close to the rates in white children alone anyway (88.15 and 81.07). Combined rates therefore were mostly pulled downward by reductions in whites.
With rates of deaths for other causes now so low, likelihood of knowing of children who died from these causes before high school graduation would vary substantially from place to place.
Gale, AH. (1945.) “A century of changes in the mortality and incidence of the principal infections of childhood.” Arch Dis Child. 1945 Mar; 20(101): 2–21.
This would span, both, a period when only registered jurisdictions were included, and a period when statistics represented the whole country. This is not a limitation but rather ensures quality of reporting throughout, as well as consistent disease classification (at the topmost level, there is never anything that can be done about doctor discretion etc.). However, it will also mean that New York City is more heavily represented in earlier years, which unfortunately makes it impossible to make any clean cut-off between pre- and post-vaccine periods (because Park is experimenting with wide-scale vaccination almost a decade before any other cities). Similar problems affect the pertussis vaccine.
Method:
Influenza and pneumonia were left out at first because I hadn’t yet thought of the method for unifying the scale of all diseases, and afterward because I felt there would have been too much distortion from the substantial aging of the American population over the decades in question to be truly reflective of disease trends (without a lot of extra standardization).
The acceleration after 1918 is likely a pull-forward effect, as the Spanish Flu seemingly caused a spike in deaths among tuberculosis cases.


