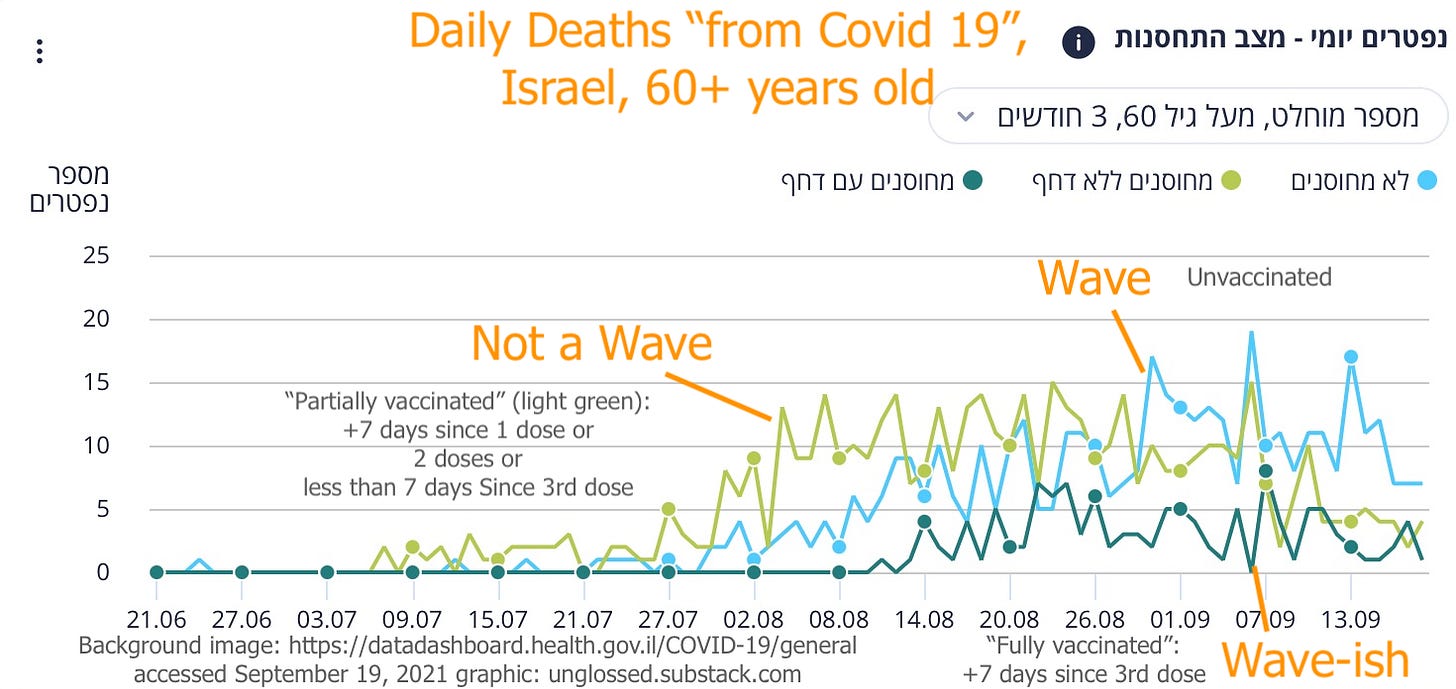
Israel’s mass roll-out of boosters after July 31, including to a significant share of under 60 year-olds, ensured that the country and her dashboard would never provide a useful window into Covid vaccine efficacy sans booster again. This tragedy struck only a handful of weeks after the dashboard began providing a clear distinction between that group - the “fully” Covid-vaccinated - and the dwindling control groups of unvaccinated and “partially” vaccinated, allowing a real-time view of the absolute and per-capita infection and severe outcome rates for all three.
With the boosters, the terms “partially” and “fully” vaccinated were redefined, and thereafter appeared so intentionally distorted that it was hard to see how anything useful could be gleaned anymore. And as if to throw salt in the wound, I had just reloaded ten dollars credit onto my “Ministry of Health Dashboard Rewards Club” app.
But I was being too pessimistic. The dashboard, it turns out, provides definitions for its updated standards in the user manual; additionally, an either new or previously ignored (by me) section provides delineated values for deaths for all three groups.1 Combined with the daily figures for triple-dosing, these things reveal a very interesting signal:
The dashboard, naturally, also plots out administration of 3rd doses. Here in the Chrome-translated version with sticky buttons:
Using the dashboard’s provided cumulative 3rd dose value on July 30, September 1, and September 18, we can overlay the period of highest uptake, and additionally examine the 6 day window where 3rd dose recipients on September 1 were still considered “partially vaccinated”:
The same pattern is almost legible in the daily deaths for under 60 years-old as well. However, even though unvaccinated 40 and 50 year-olds have been a driver of hospitalizations throughout the summer, there have been only a handful deaths from the under 60 group. The sample size is thus too small to provide a reliable signal:
For the over 60 years-old group, this “flat surge” seems to have amounted to ~400 deaths. But whatever factor is causing the “flat surge” is likely not responsible for all of those deaths, given how many different groups now make up the “partially” vaccinated: Those with just 1 dose, those with 2 doses, and those less than 7 days from the 3rd dose.
Without a breakdown of the heterogenous "partially" group, attributing the "flat surge" in August to the "<7 days 3rd dosed" sub-group is perilous, especially since they likely account for less time-scaled exposure risk than those with 2 doses. But what other explanation is there for a flat deaths rate in the middle of a wave, than the influence of the steady booster roll-out? Infections and severe illness were increasing; but daily administration of triple-doses was steady. And when the latter ceases, so do the deaths.
Or, we could propose that the “flatness” of the surge is an artifact of the simultaneous reduction in size of the “partially” vaccinated cohort while per-100k death rates were rising due to the summer wave. This faces a central problem: per-100k death rates went down after the booster group was no longer in consideration. From the Chrome-translated version:
An association with triple dosing is not contradicted in severe illness rates either.
Absolute rates of new admission for severe illness for over 60 years-old again leave open the possibility that the trend could just be a coincidental artifact of reducing the pool of “partially” vaccinated while per-capita severe outcome rates rise. Yet, once again, per-100k severe illness rates actually go down once the transition completes. From the Chrome-translated version:
The per-100k rates do rise at the same time frame as the flat surge, and lower afterward. Not to any degree that demands associating triple dosing, as opposed to the prevailing trends and happenstance, with the change - but in a way that is nonetheless consistent with a temporary additive force that then goes away.
However, there is a selection bias for this group, since throughout August the currently infected do not leave the group via boosting, resulting in a less infection-susceptible pool in September. A "partially vaccinated, not previously infected per-100k" graph might not show a drop in September, placing a coincidental artifact back on the table. (“Partially” vaccinated remains a substantial portion of age groups over 60; in fact, 2nd-dose recipients are still the 2nd most common status for 40 and above - though that says nothing about their share in infection and outcome rates.2)
The assumption of an association with boosting, additionally, provides a valid justification for using the before and after trend of ~4 deaths per day to estimate the “flat surge” portion of the ~400 deaths. This lands the share somewhere in the low 300s.3
Reconciling the wildly irresponsible attribution for these deaths suggested above to one of the only studies measuring outcomes for booster recipients, by Bar-On, Y. et al., yields grounds for an additional wild suggestion.5
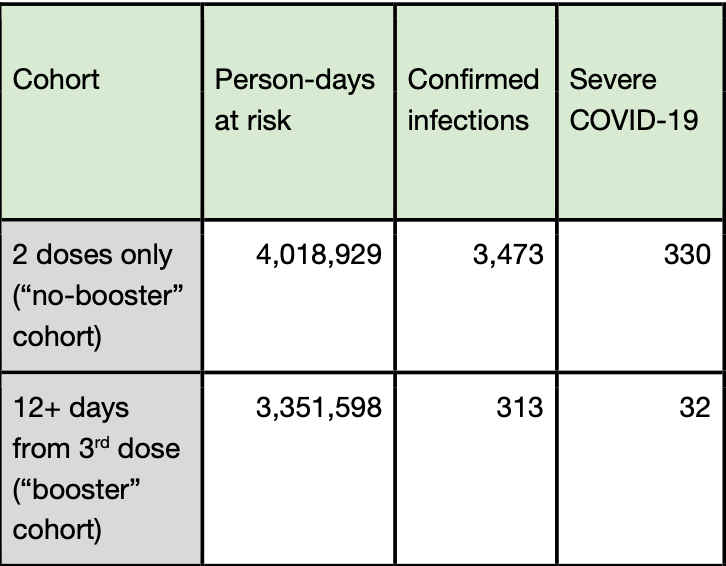
We can cover the study very briefly, since we are far beyond the universe of rigorous data. The study itself is of a format called “The test subjects and the control subjects are literally the same subjects, but we know how to do math, cha-ching.” Even despite such an audacious format, it still strikes as conspicuous that almost no information is provided in the study about outcomes in the first 12 days after the booster. Only results from before and after that window are provided:6
Until now, I have found the question of what infection outcomes are really prevailing within the Bermuda Triangle of dosed but “not fully” vaccinated recipients uninteresting. But the chart above is practically a glove thrown on the ground. As nearly as I can interpret the study text, “person-days” for individuals in the 11 day window during the study period are at least 6,000,000.7 Why didn’t the authors include any outcomes from such a large segment of their observed data? This may have to do with the way outcomes are reported in their accessed version of the Ministry of Health data, which evidently differs from the dashboard quite a bit. But the impression is that they could have extracted day 1 - 11 events, and chose not to - or did, and chose not to report them.
What the authors do report, however, is that there is no per-capita surge in newly confirmed infections in the first days after triple-dosing. In fact, there are fewer infections compared to the pseudo-control cohort, which lead the authors to conclude that the boosters are providing “infection efficacy” compared to (elapsed) 2 dose protection right off the bat:
Reverse-calculating infections from the infection efficacy and person-days values implies ~3,500 infections in the 12 day window, almost same as the “2nd only” value.8 Thus, to take this very mathematically tortured study for its word, and once again bearing in mind that there were a lot more “person-days” within the window than before it, there were fewer per-capita per-day infections in the days after the third dose.
Still, there is no way to figure how many were severe; and the study doesn’t report deaths. Thus, the study should not be taken in any way to support the wild assumption that boosters are contributing to the “flat surge” in August.
All it does, is offer an angle for elaborating that wild assumption: Because boosters are not contributing to a surge of infections - in fact they are reducing test-confirmed infection - there is little support for attributing this small handful of ~330 wildly assumed booster-associated deaths to the infections themselves.
These, rather, are just the small handful of wildly assumed booster-associated deaths in Israel that happened to be preceded by a positive for infection.
See https://datadashboard.health.gov.il/COVID-19/general
From the guide, Chrome-translated:
"Immunized with impulse dose" are those who have received 3 doses of vaccine and it has been 7 days since receiving the third dose.
"Immunized without impulse dose" are those who have received 3 doses of vaccine and have not yet passed 7 days since receiving the third dose or those who have received 2 doses of vaccine and have passed 7 days since receiving the second dose or recovering vaccinated in one dose and 7 days after receiving the dose.
"Unvaccinated" are those who have not received a first dose of vaccine. [Presumably, 1st dose recipients less than 7 days out are also included here.]
I may try to compile the actual death count later, and update this value to reflect the result.
Bar-On, Y. et al. “BNT162b2 vaccine booster dose protection: A nationwide study from Israel.” medrxiv.org
On its own, this is the most interesting result of the study, though the format makes calling anything a “result” perilous. Triple dosing appears to have reduced incidence of infection, but not to have meaningfully improved on the severe outcome efficacy per infection (which was still observably durable, as noted previously). Since it is reasonable to imagine, in advance of more data, that triple-dose “infection efficacy” will prove just as transient as the first 2 doses, that means boosters only provide a benefit for ~4 months. Any booster schedule longer than that introduces a “mid-booster exposure window;” the percentage of exposure during that window, compared to the overall interval, corresponds to the back-of-the-envelope percentage of recipients who will receive no “benefit” from the booster at all.
If not much higher. For any individual among the 1,144,690 eligible study subjects who crossed the 11-day window during the July 30 - August 22 observation period, just under half their “person days” fall within that window (the other half includes both their “pre” and “post” “person days”).
With the incredibly generous assumption that I mathed correctly. Still, such a value is consistent with dashboard-provided confirmed infection trends during August.


It seems unlikely so many people would collect data this significant so poorly, purely by incompetence. It seems more likely they're purposely trying to obscure the truth.
Figure 2 has an interesting note: "Because of wide confidence intervals, only days 1-16 are shown"
(from https://hiddenmarkov.substack.com/p/12-daysjust-12-days): a couple of weeks later, they published https://www.nejm.org/doi/full/10.1056/NEJMoa2114255 but for some reason, despite the same, wide confidence intervals, they now show up to day 25.
The peak additive protection appears to occur around day 21. I guesstimate the effect will be gone in 2 months or less.
So much for a 6 monthly booster?