


Solution to the Steve Kirsch Survey Proof
As far as I can tell, it is a Kobayashi Maru exercise for the vaccine.

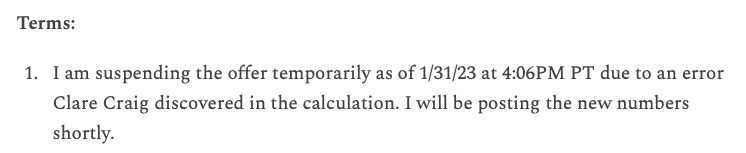
*edit, February 1: Kirsch has now scrapped the “proof” and suspended the corresponding bet offer based on a limited, or should I say, modified acceptance of my solution. More details in the “update” section below.

And so welcome back, readers, to Unglossed, the anti-Covid-vaccine blog that enjoys double-checking the work of other anti-Covid-vaccine blogs, in the spirit of providing the reader an accurate picture of reality, regardless of whatever narrative it supports, despite having just declared that exact endeavor impossible.
Today, Steve Kirsch has published an alleged proof that Covid vaccines shortened life-spans:

I won’t reproduce the puzzle here. I am merely publishing what I believe is a simple proof that the proof is not valid.
Thus, the solution below is covered under spoiler alert.
It was actually fun to work out the problem in Steve’s proof. So if the reader wants to crack the puzzle for themselves, then it goes without saying that they should not look at the solution here. Rather, go read Kirsch’s post.
(Also the solution is technically obvious, and had already been pointed out in comments in Kirsch’s post — but it is only obvious as words. Akin to how it’s “obvious” that if a car’s average speed through a tunnel is speeding, it must have been speeding at some point; but proving it still requires thought.)
Solution: Vaccine Kobayashi Maru
The Kobayashi Maru, if any readers are unfamiliar, is a fictional training simulation in Star Trek. The problem with the Kobayashi Maru is that it is absolutely unwinnable, much to the chagrin of Kirstie Alley’s character in the second movie (RIP).
How we deal with death, is at least as important as how we deal with life, wouldn’t you say?
With the tunnel problem in mind, I realized at last that demonstrating / proving the solution which seemed obvious in words merely required showing that the design of Kirsch’s “proof” was a Kobayashi Maru.
Therefore, assume that deaths are distributed perfectly evenly through time, and all die-ers are observed from a uniform starting date.
Kirsch’s design would compute the ratio of time alive to observed time, which in the model below would be the volume of the yellow area divided by the volume of yellow and purple together. It would be exactly half the rectangle, i.e. .5:

This is essentially how the unvaccinated die-ers are measured. The result is not .5 because the distribution is not perfectly even for the unvaccinated. This doesn’t matter for our model.
Next, assume any event is being observed:

In this case, Kirsch is measuring the date of last Covid vaccine injection. Note that this will exacerbate the effect as the late die-ers (top) would be “re-upping” their injections with boosters as they went along the year not dying.
This exacerbation issue isn’t important for our proof, because all that matters is that no matter what event is measured or when, it is completely impossible to return a result equal to or higher than .5:

Thus, it is shown that the design creates a no-win situation for the vaccine if an even distribution of deaths is assumed. Thus, no result can be meaningful or revealing of anything besides perhaps how frequently people tended to “re-up” with boosters before death.
But is the distribution even? In fact, for the vaccinated, deaths are lopsided toward the middle of the observation period, which would reflect the winter 2021/22 BA.1 and other respiratory illness surge. However, as best as I could calculate (which obviously was done before launching into a proof using an even distribution), the no-event alive/observed ratio for the vaccinated is .58. Therefore, the proof above should be adequate and not require a simulation using a different distribution:
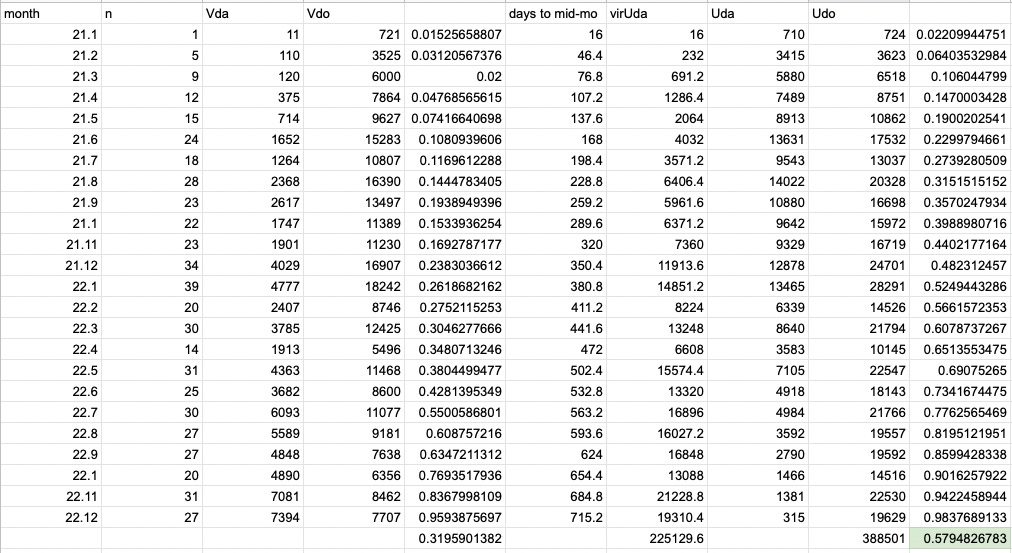
(Note that the original version of this post reported the rate as .5, as I still had that cell set to report the average for the column.)
.58, in other words, seems to be the result for the vaccinated if they are measured the same way as the unvaccinated, from the beginning of the observation window to the end (which results in .55 - *edit: .55 was the value obtained due to an error in the airtable function for days alive since January 1, 2021. I had already realized this was the case for the vaccinated, hence my use of a virtual days alive value based on mid-month days, but had not yet confirmed it for the unvaccinated. Kirsch has since also noticed the error and fixed the corresponding function. The correct unvaccinated days alive / observed ratio is .42.).
Moreover, a more apt comparison would be between the Kobayashi-Maru-ed vaccinated group and the unvaccinated who are individually “tagged” on the same exposure date as the vaccinated. Lots of studies work this way, finding a demographically matched control and watching them from the same day as the vaccinated subject.
Anyhow, that’s my proof I think, or maybe I goofed this one!
Update on February 1, 2023
Kirsch subsequently acknowledged the partial problem of “re-up-ing” with boosters, but not the overall veracity of my “any event” proof. To quote the current wording of his position:
So I could have picked vax #1 date, vax #2 date, vax #3 day, etc. date for an individual (which would vary for each person), an arbitrary day of the year (assuming nothing external is happening like a Delta surge), date of vax availability, etc. You just can’t pick a start time that has implicit knowledge of the date that the person died (such as “your last vaccination before you died”). I apologize for the error.
Note that Kirsch credits the “discovery” of the acknowledged problems that led to these revisions to Claire Craig, although they are mentioned explicitly in my post (even if my post doesn’t rest its case on the acknowledged problems). However, my post predates the same so-called “discovery” of the re-up-ing problem, even if it does not emphasize / rest its case on the “re-up-ing” problem. Therefore, it eludes me how the following sentence on Kirsch’s post can be considered fully transparent:
It would seem more accurate to say that the bet offer has been suspended because I discovered and posted the risk factors in question, both in Kirsch’s comments and here, in the spirit of providing value to him and to my readers. Kirsch’s disagreement that my proof applies to any event does not change who pointed out that it is even “worse” for a relative, “most recent” event.
Moving on.
Kirsch is certainly free not to accept my proof, 100% — but, this refusal does not constitute a refutation of my proof. As far as I can ascertain, he has not demonstrated that for some reason only death-relative events, not any events, cause the no-win scenario my model proves. How could he? Therefore (as far as I can ascertain), my model and proof remain unimpeached. As an easy demonstration, observe that the model still shows the same no-win scenario even if applied to a mixed population:

Have I just proven that the Covid vaccine is also killing the unvaccinated?! (No.)
Rather, it is simply not possible to observe any neutral event, absolute or death-relative, without reducing the alive / observed ratio vs. a neutral starting date. How can neutral events occurring after the starting date possibly add time alive?
Thus, observation of reduced survival time vs. a neutral starting date can not tell us that the event in question is non-neutral. It is a Kobayashi Maru.
And so, my response to the February 1 semi-rebuttal
Nonetheless, Kirsch has provisionally reconstructed his proof around a time from first-dose analysis (i.e., because he asserts this affords an out to my proof). To reiterate, it is totally fine for Kirsch to assert (incorrectly) that my model and proof do not demonstrate that using “any event” is doomed to create a no-win scenario; but this same assertion is not in any sense a mathematical demonstration that my proof is wrong. I welcome being shown wrong. But being asserted wrong without proof is, imho, meaningless.
Regardless, I have replicated my previous proof from scratch, this time by using by-month first-vaccine-date values according to Kirsch’s remodeling of the airtable.

*update, February 2:
In a follow-up post, I provide more detail on the mea culpas in Kirsch’s updates that are dissonant with the actual flaws which have been realized and modified due to the (partial) acknowledgement of my proof.

If you derived value from this post, please drop a few coins in your fact-barista’s tip jar.


Is this just Steve “jumping the gun” again?
I like that he brings these things up and he provides some interesting points of view but many on closer inspection turn out be 🤷
I couldn’t really follow his methodology at a glance, sounded good but when you start taking ratios at different points in time and taking averages etc. it’s a good way to mess things up if your not careful. Not saying he has, but if what you've written is a fair assessment of his method, I can totally see the issue. I can clearly follow your example but find it hard to relate it directly to Steve’s analysis mainly because I can’t follow Steve’s logic fully (could be lack of trying on my part).
I don’t really want to spend the time unraveling his post. I’m sure others like yourself did/will do a better job at it. I hope Norman Fenton or Clare Craig will do a deep dive after being name dropped. Even if they agree with his methodology they would be able to show why his critics are wrong.
I look forward to more skeptical discussion of his findings, not because I disagree with him, I hope he has found a silver bullet but it has to stand up better scrutiny than just “put up or shut up.”
Is this Groundhog’s Day? Didn’t we go through this circus act like a year ago? With the same incredibly small sample size with self-reported results submitted by an audience that is definitely not a random distribution? Is this what handwaving looks like?
I’d probably reflexively puke in my mouth less if it wasn’t presented like a “get rich quick” or “miracle cure” scam website. COMPLETE with BOLDED TEXT and APPEALS TO AUTHORITY to demonstrate that IT IS IMPOSSIBLE I am wrong! And if I am, you CAN WIN BEN STEIN’S MONEY!!!
Maybe I’m just cranky, but I’m past the point where these things are just a cute character quirk, and their heart is in the right place, yada yada. If this is what the being anti-vax means, I don’t even care which side wins. You’re just exchanging one group of egotistical sociopaths for another (which is on brand for humanity, give a cursory review of history).